Where Are B.C.'s EV Charging Stations, and Where Are They Missing?
2,089 public charging stations cleaned and mapped city by city, showing where B.C.'s network is dense and where it barely exists.
British Columbia has 2,089 public EV charging stations spread across 261 cities. That sounds substantial, until the distribution is broken down: 192 of those cities, over 70%, have fewer than five stations each. Most of the real work happened before any chart got made.
Pipeline
- 01
Clean
- 02
Map
- 03
Compare
- 04
Interpret
2,089
public charging stations in B.C.
4,071
Level 2 charging ports
1,568
DC Fast charging ports
192 / 261
cities with fewer than 5 stations
01 / The data
A province's charging network, cleaned to 24 variables
The source is Natural Resources Canada's Alternative Fuelling Station Locator, which compiles station data from industry submissions and user updates, confirmed annually. Of the two datasets it offers, the EV Charging Stations set was chosen over the general Fuel Stations set for its focus on public EV infrastructure and its larger number of observations.
The analysis took a city-level approach for simplicity: regional entries like “Central Okanagan” were excluded automatically, avoiding a manual region-to-city conversion. The dataset was narrowed to 24 relevant variables, with missing values, duplicate station name and city pairs, and redundant French-language columns removed. One entry that listed “British Columbia” as a city, rather than an actual city name, was corrected to “Tatla Lake” based on the station's name and coordinates.
02 / Distribution
Most cities in B.C. have almost no charging infrastructure
British Columbia has 2,089 public EV charging stations in total. Spread across 261 cities, that sounds substantial, until the distribution is broken down: 192 of those cities, over 70%, have fewer than five stations each.
The original analysis used an interactive Leaflet map of all 2,089 station coordinates. The markers cluster tightly around the southern urban corridor and thin out quickly moving north.
03 / Charger types
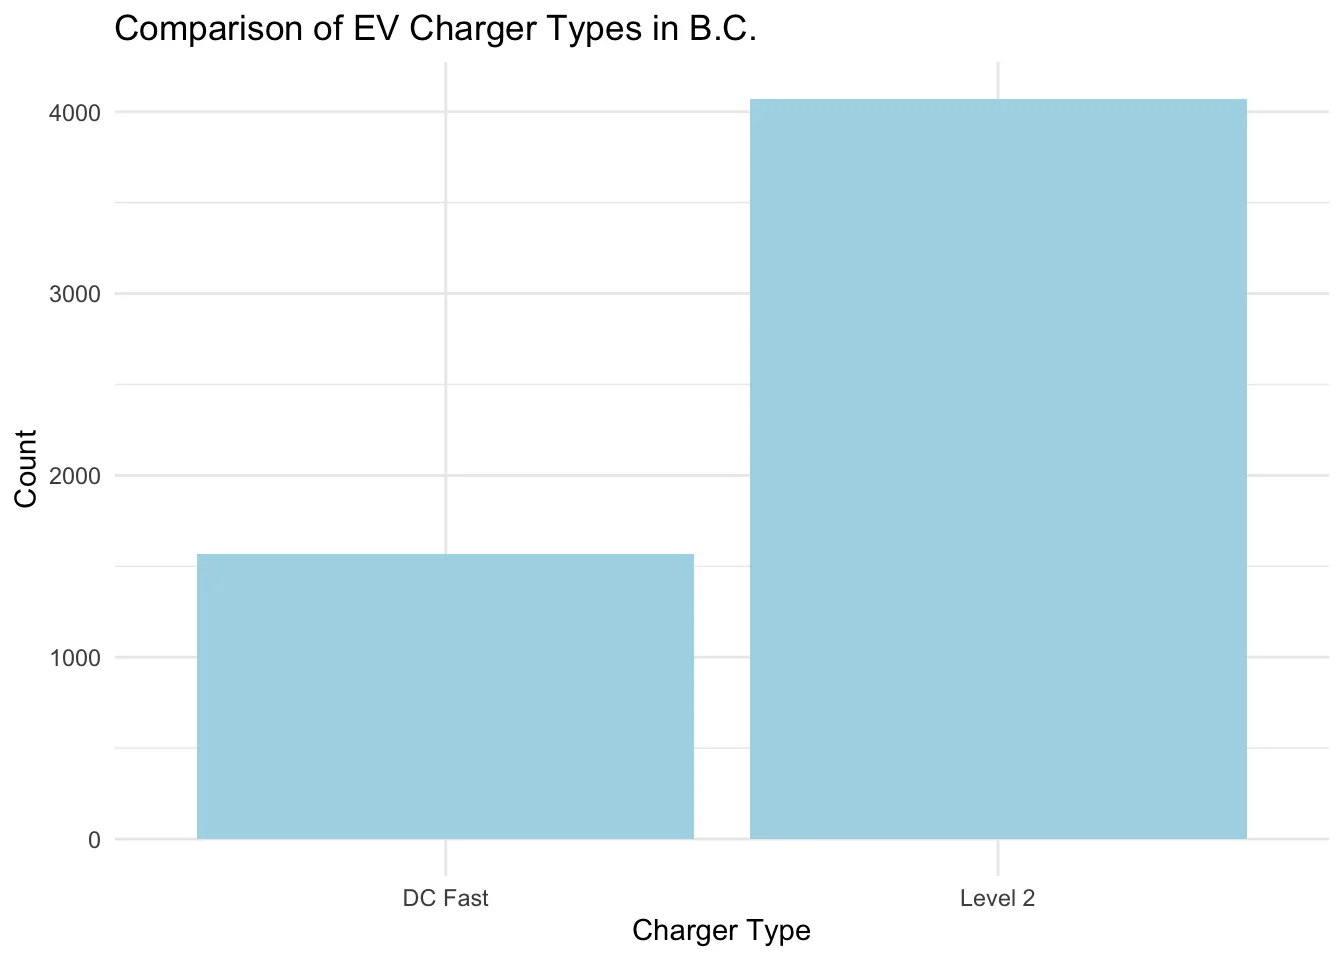
Level 2 chargers outnumber DC Fast almost three to one
Comparing charger types across the province shows a clear imbalance: 4,071 Level 2 ports versus 1,568 DC Fast ports.
04 / Paid access
Paid charging is concentrated in a handful of cities
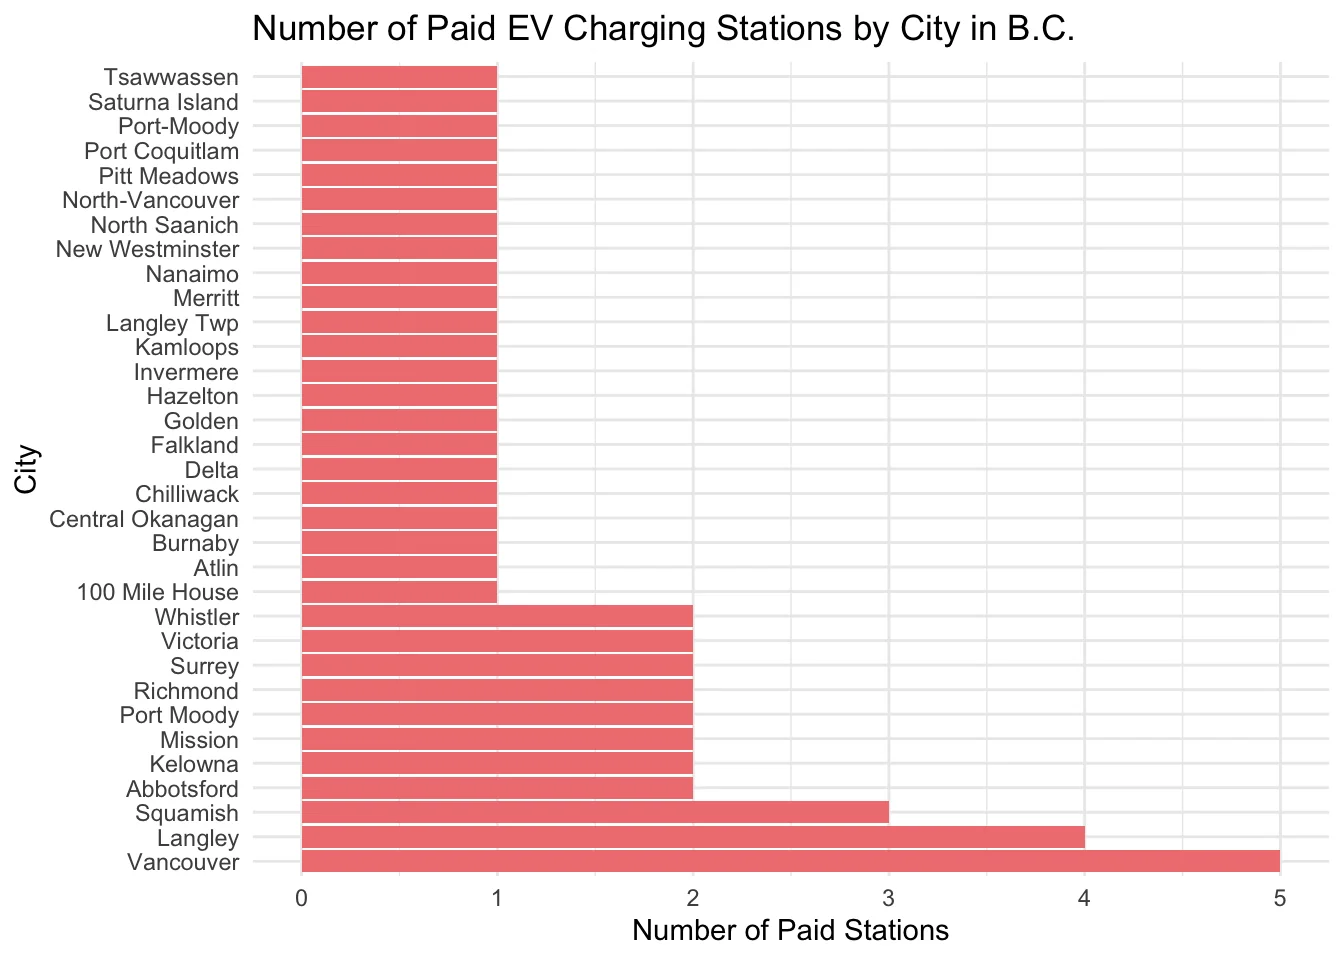
Looking specifically at paid stations, identified through the Cards Accepted field, highlights where affordability and access differ most sharply across the province.
Vancouver leads with 5 paid stations, followed by Langley with 4 and Squamish with 3. Most other cities on the list, including Victoria, Surrey, Richmond, and Whistler, have only 1 or 2. The gap between Vancouver and everywhere else suggests paid charging infrastructure is concentrated in a few urban markets, leaving smaller cities with little to no paid charging option at all.
05 / Data quality
What the dataset makes harder than it should be
Addresses and duplicates
Specific stations were often found near, rather than exactly at, their listed address when checked manually. Duplicate entries under the same station name and city also had to be removed before the counts above could be trusted.
Regions mixed with cities
The location field mixes true cities with broader regional names like “Central Okanagan” in the same column, with no built-in way to tell them apart. The city-level approach here filtered most of that out, but a cleaner source field would make the distinction explicit.
06 / What this demonstrates
Turning a messy public dataset into a usable map
Most of the real work here happened before any chart got made: deciding what counted as a duplicate, what “British Columbia” as a city name actually meant, and which access-code field to trust.
- Filtering and standardizing raw government data
- Resolving duplicate and mislabeled entries
- Selecting the right field among near-duplicate columns
- Comparing categorical infrastructure counts
- Visualizing geographic distribution
- Flagging data-quality caveats for future analysis
Tools and methods