Do Forest Habitats Support Greater Bird Species Richness?
A one-tailed Welch test on forest versus non-forest richness, read alongside a median that points the other way.
A Northern Italy dataset compares bird species richness (BSR) in forest sites against agricultural, grassland, mixed and urban habitats: descriptively first, then with a directional hypothesis test. The mean and median tell somewhat different stories, and both habitat groups carry substantial variability.
Pipeline
- 01
Group
- 02
Describe
- 03
Visualize
- 04
Test
- 05
Interpret
22.99
Forest, mean BSR
18.02
Non-forest, mean BSR
2.1733
Welch t statistic
0.01501
One-tailed p-value
01 / Descriptive comparison
Forest sites score higher on average, but not on the median
Bird species richness was summarized with mean, median, and standard deviation for forest versus every non-forest habitat combined, before any hypothesis test was run.
| Habitat | Mean BSR | Median BSR | SD BSR |
|---|---|---|---|
| Forest | 22.99464 | 11 | 31.81482 |
| Non-forest | 18.01501 | 12 | 36.76618 |
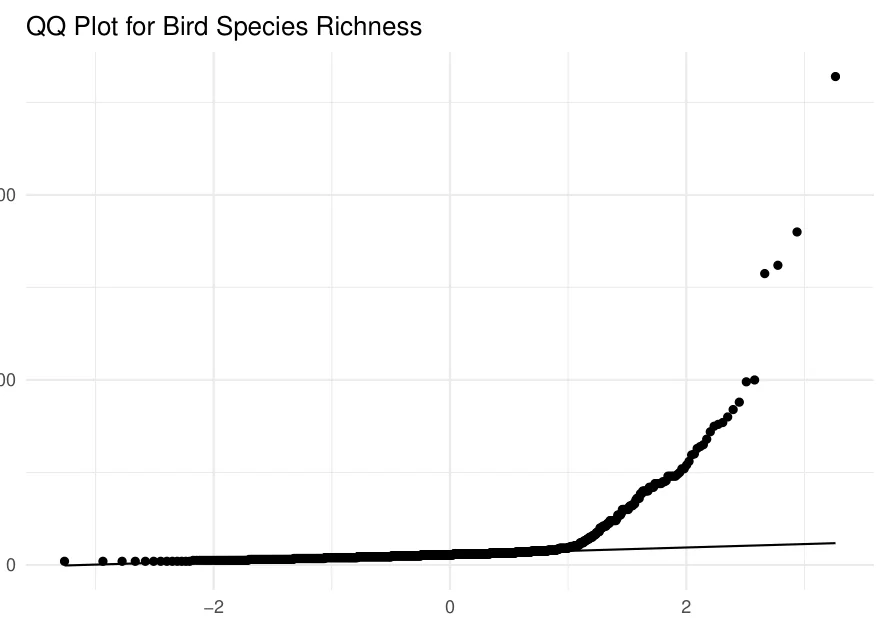
Notice the median tells a slightly different story: forest's median (11) is actually a touch lower than non-forest's (12). Both groups also carry large standard deviations, with non-forest habitats showing the wider spread. The mean is being pulled by a handful of especially rich sites, not by every forest location scoring uniformly higher.
02 / Distribution across habitats
What the two-group comparison hides
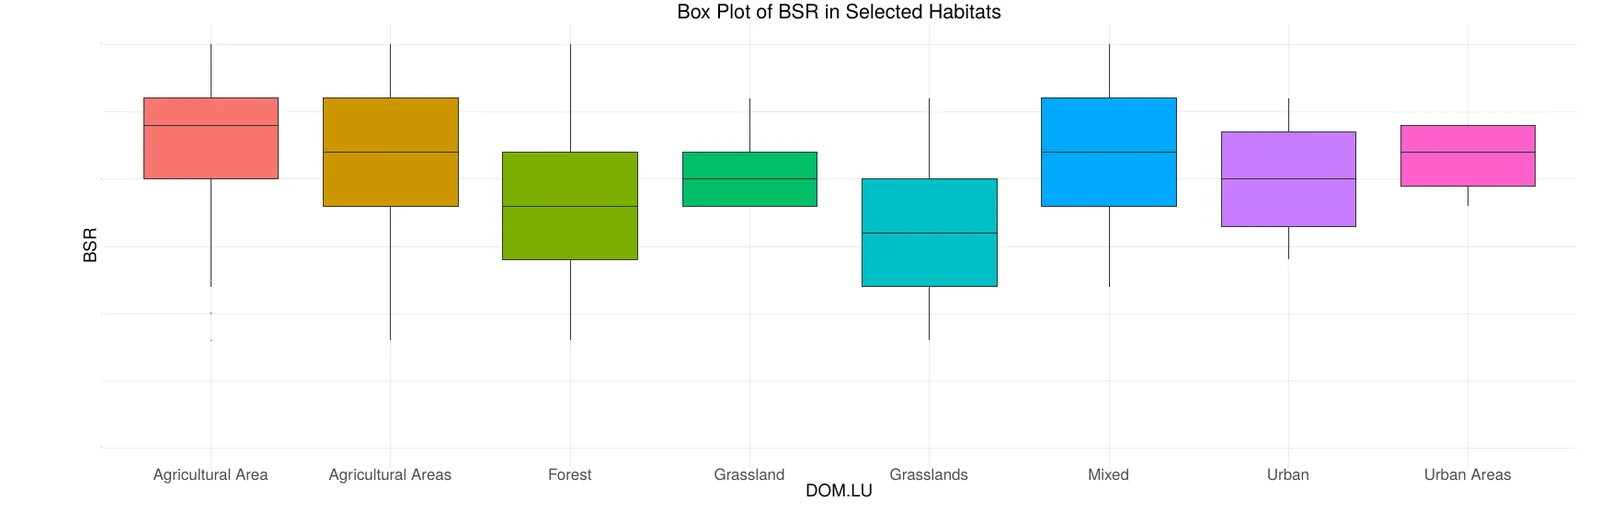
Collapsing everything into “forest” versus “non-forest” is convenient for a t-test, but it flattens real differences between habitat types. Breaking BSR out by the original DOM.LU labels shows a fuller picture.
Two categories (River, and Riparian Vegetation or Reforestation) were excluded from this chart because each had only a single observation, not enough to draw a meaningful box. Even here, “Agricultural Area” and “Agricultural Areas,” and “Urban” and “Urban Areas,” are kept as separate labels rather than merged, so the same underlying habitat type is effectively split across two bars.
03 / Statistical result
Running the one-tailed test
A one-tailed, two-sample Welch t-test was used to test a directional claim: that forest habitats support more species than non-forest habitats, not merely a different amount.
H0 · null
Forest habitats support the same or fewer bird species than non-forest habitats (μ_forest − μ_non-forest ≤ 0).
H1 · alternative
Forest habitats support significantly more bird species than non-forest habitats (μ_forest − μ_non-forest > 0).
Result · H₀ rejected
Welch two-sample t-test: t = 2.1733, df = 864.35, p = 0.01501. 95% one-sided confidence interval: 1.206843 to ∞. Because the one-tailed p-value falls below 0.05, the original analysis rejected the null hypothesis in favour of greater mean BSR in forest habitats.
04 / Variability and method considerations
Where this result needs a caveat
Variability matters
Although forest had the higher mean, its median BSR was slightly lower than non-forest's (11 vs. 12), and both groups carried large standard deviations. That's substantial site-to-site variation. The average shouldn't be read as describing every forest or non-forest location.
A binary comparison, and duplicate labels
Collapsing every non-forest habitat into one group is a simplification, and the original report also flags the general risk of drawing conclusions from many comparisons at once. The underlying DOM.LU field contains near-duplicate labels (singular and plural forms of the same habitat) which is worth cleaning up before extending this analysis.
Within the scope of this analysis, the result supports prioritizing forest protection and restoration as one strategy for maintaining bird species richness. Further research is needed into which specific forest characteristics drive the advantage.
05 / What this demonstrates
From a hunch to a defensible test
Turning “forests seem better for birds” into something testable meant framing a direction, not just a difference, and then checking whether the data backed it up.
- Framing a directional hypothesis
- Summarizing with mean, median, and standard deviation
- Comparing habitat distributions visually
- Applying a one-tailed two-sample t-test
- Reading variance alongside the mean
- Translating statistical evidence into a recommendation
Tools and methods