Impact of Land Use on Bird Species Diversity
An ANOVA plan that became a Kruskal-Wallis test once normality failed, with p = 0.063 reported as exactly what it is.
Bird species richness was compared across habitat types in Northern Italy: forest, agricultural, grassland, urban, mixed, and other. Answering the question honestly meant checking whether the data could support the test the question implied.
Pipeline
- 01
Check assumptions
- 02
Adapt method
- 03
Interpret conservatively
8
habitat labels assessed for normality
16.199
Kruskal-Wallis chi-squared
0.063
p-value (threshold: 0.05)
9
degrees of freedom
01 / Analytical approach
From an ANOVA plan to a non-parametric test
The original question was simple: do forest habitats support greater bird diversity than agricultural, grassland, urban, mixed, and other land-use types? Answering it honestly meant checking whether the data could support the test that question implied.
- 01
Define the comparison
Bird species richness compared across habitat groups defined by the dominant land-use variable. Null: richness is equal across habitats. Alternative: at least one differs.
- 02
Check normality
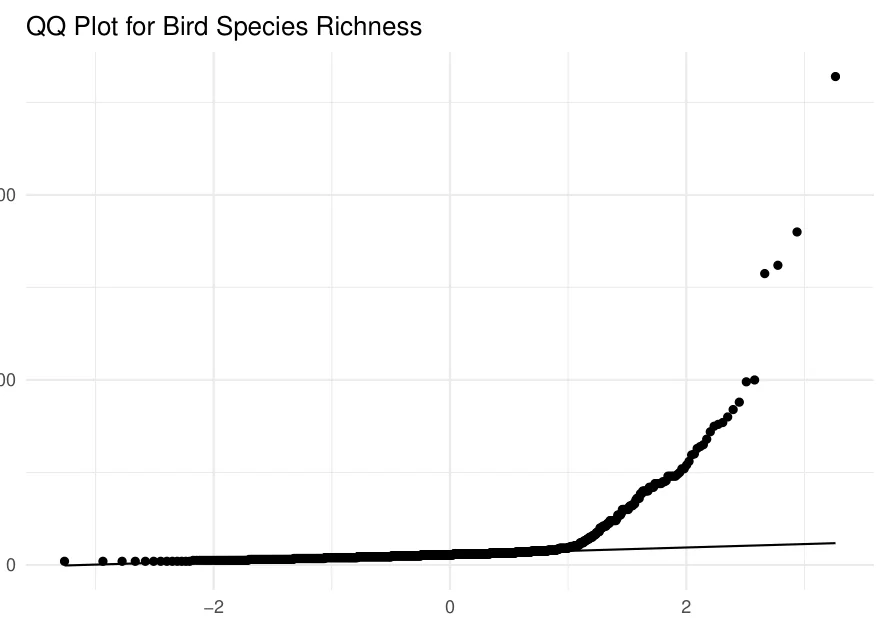
Shapiro-Wilk tests run within each habitat group, backed by a QQ plot of richness. Most groups failed the normality assumption.
- 03
Select the right test
With normality unsupported for most categories, the analysis moved to the Kruskal-Wallis rank-sum test instead of ANOVA.
02 / Results
Normality diagnostics and habitat comparison
Eight habitat labels, tested one by one. Most failed the normality check outright, and only three came back looking approximately normal.
| Habitat label | Shapiro-Wilk p-value | Interpretation |
|---|---|---|
| Agricultural Area | 2.40e-7 | Non-normal |
| Agricultural Areas | 2.24e-28 | Non-normal |
| Forest | 1.16e-29 | Non-normal |
| Grassland | 0.314 | Approx. normal |
| Grasslands | 1.00e-8 | Non-normal |
| Mixed | 1.34e-14 | Non-normal |
| Urban | 0.719 | Approx. normal |
| Urban Areas | 0.224 | Approx. normal |
The plot backs up the table: points track the reference line through the lower and middle range, then peel sharply upward in the right tail. That upper-tail deviation is what ruled out relying on the normality assumption for the habitat comparison.
H0 · null
Bird species richness is equal across habitat categories.
H1 · alternative
At least one habitat category differs.
Result · failed to reject H₀
Kruskal-Wallis: chi-squared = 16.199, df = 9, p = 0.06285. At α = 0.05, the p-value sits just above the significance threshold. The null hypothesis is not rejected.
03 / Interpretation and recommendations
Turning the statistical result into a defensible conclusion
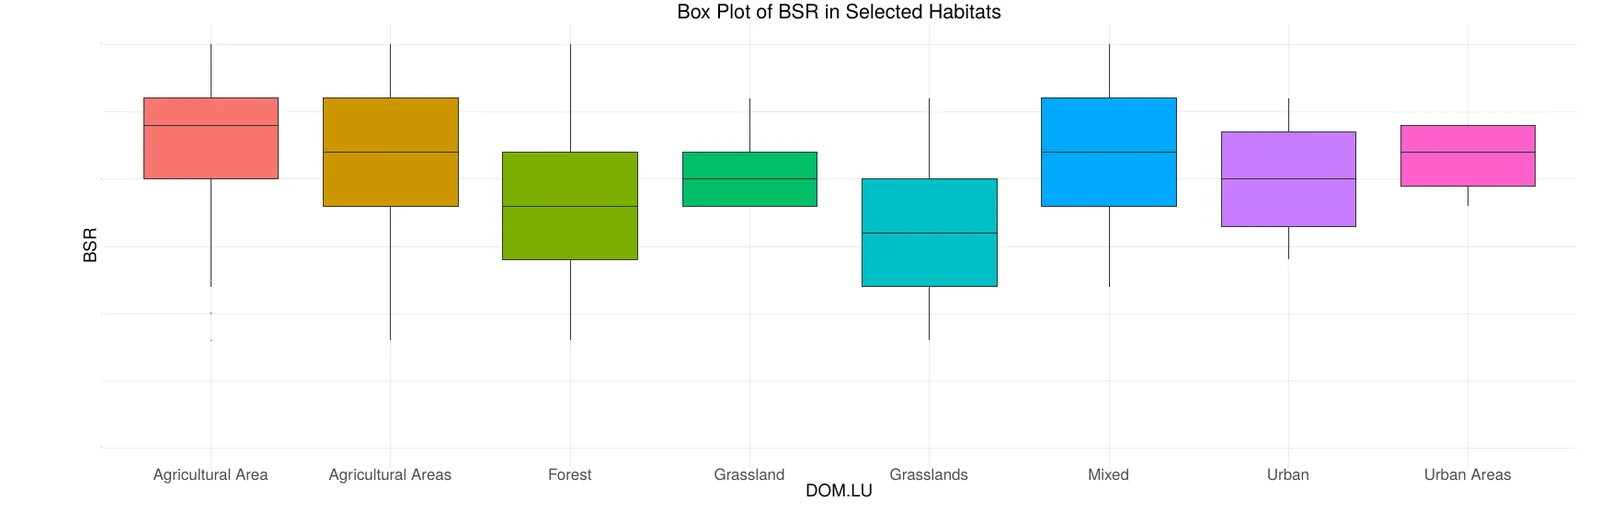
The dominant land-use field contained inconsistent labels: the same habitat, split across near-duplicate names. That fragments what should be one group into two smaller, noisier ones.
"Agricultural Area"  +  "Agricultural Areas"   →  Agricultural
"Grassland"          +  "Grasslands"          →  Grassland
"Urban"              +  "Urban Areas"         →  Urban
Label consolidation recommended before re-running
Recommended next steps: standardize the DOM.LU categories, repeat the normality diagnostics, and re-run the Kruskal-Wallis test. If a future overall comparison turns out significant, a suitable post-hoc procedure could identify which habitat pairs actually differ, and additional habitat characteristics could be explored if the underlying dataset supports it.
04 / Skills demonstrated
What each stage of the process drew on
Reasoning & diagnostics
Statistical reasoning · Data diagnostics · Environmental analytics
Testing & assessment
Hypothesis formulation · Normality assessment · Ecological interpretation
Method & data quality
Non-parametric testing · QQ plot interpretation · Data-quality awareness
Tools and methods