Comparative Analysis of Weather Patterns: Vancouver vs. Kamloops
One annual cycle of daily climate records turned into a coastal-versus-inland comparison of temperature, rain and snow, and extreme days.
How different are coastal and inland weather patterns in British Columbia? This project compares Vancouver and Kamloops across twelve months, November 2023 through October 2024, focusing on monthly temperature patterns, annual rainfall and snowfall, and the frequency of very cold and very hot days.
Pipeline
- 01
Map
- 02
Chart
- 03
Comparison
- 04
Insight
2
cities compared
12
months, Nov 2023 – Oct 2024
3
core questions
01 / Project overview
How different are coastal and inland weather patterns in British Columbia?
This project compares Vancouver and Kamloops across one full annual cycle. The analysis focuses on monthly temperature patterns, annual rainfall and snowfall, and the frequency of very cold and very hot days.
Question 01
Temperature
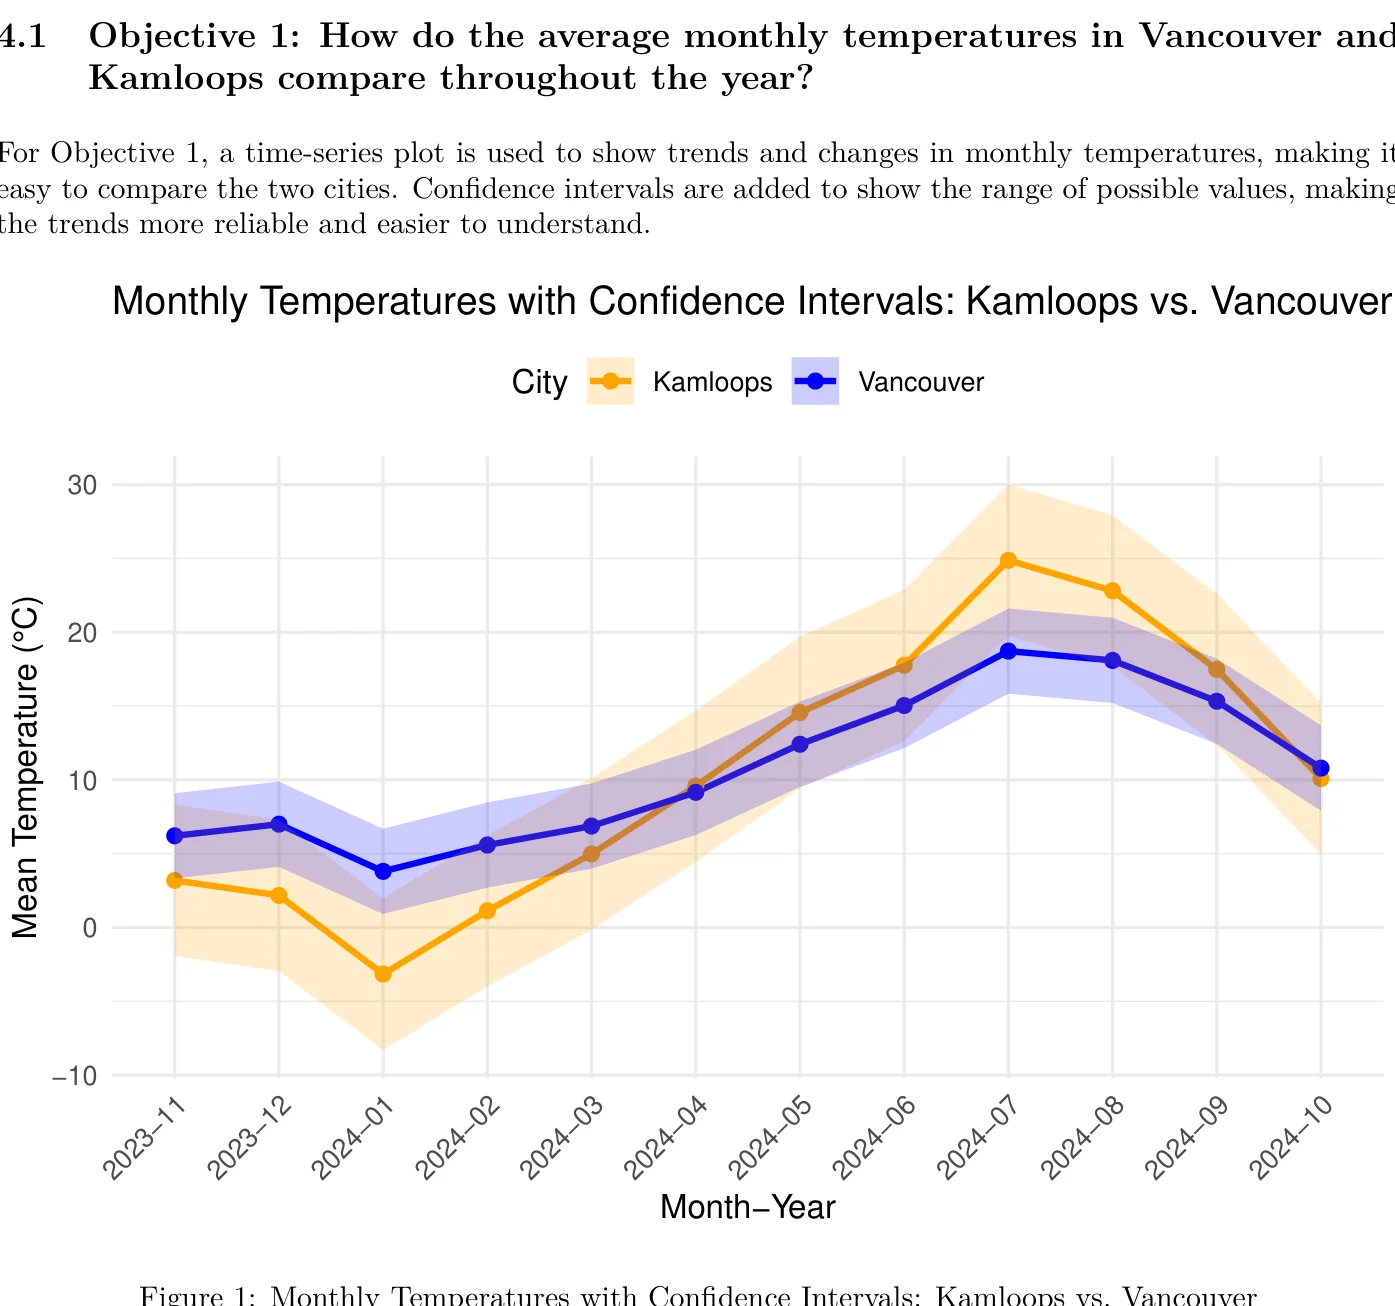
How do average monthly temperatures compare throughout the year?
Question 02
Precipitation
Which city receives more rain and which receives more snow?
Question 03
Extremes
Does Kamloops experience more days below 0°C or above 30°C?
02 / Data and preparation
Daily climate records reshaped into monthly comparisons
The source data comes from Environment and Climate Change Canada's historical climate database. Variables used in the project include daily maximum, minimum, and mean temperature, total precipitation, and total snow.
- 01Preparerename & clean
- 02Aggregatemonthly summaries
- 03Reshapejoin & long format
- 04Comparetemperature trends
- 05Maprain & snow
- 06Interpretextreme weather
03 / Monthly temperature
Kamloops shows stronger seasonal temperature variability
Monthly mean temperatures were compared using a time-series visualization with confidence intervals. Kamloops falls below 0°C during the coldest winter period and reaches about 25°C in July, while Vancouver stays milder and peaks around 19°C.
04 / Rainfall and snowfall
Vancouver is wetter; Kamloops is snowier
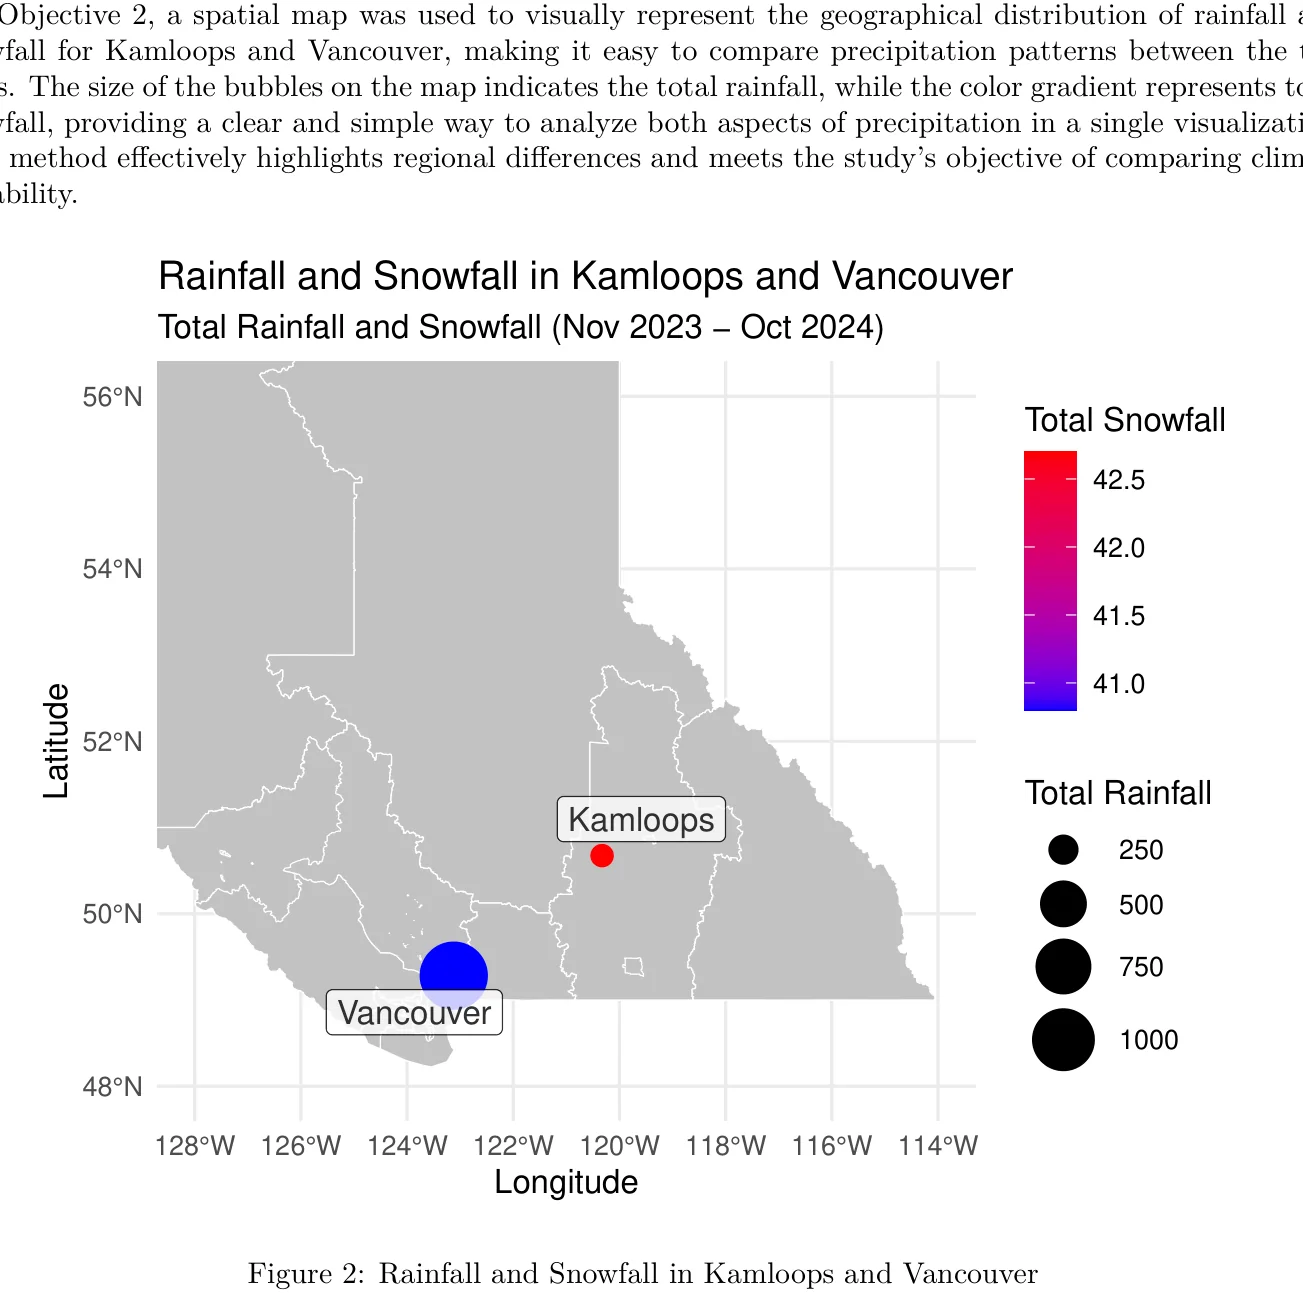
A spatial map was used to compare the two precipitation types simultaneously. Bubble size represents total rainfall, while the colour scale represents total snowfall.
Vancouver
Higher rainfall
The coastal location is associated with substantially wetter conditions over the study period.
Kamloops
Higher snowfall
The colder inland climate produces more snow despite much lower overall rainfall.
05 / Extreme-temperature days
Kamloops experiences both colder winters and hotter summers
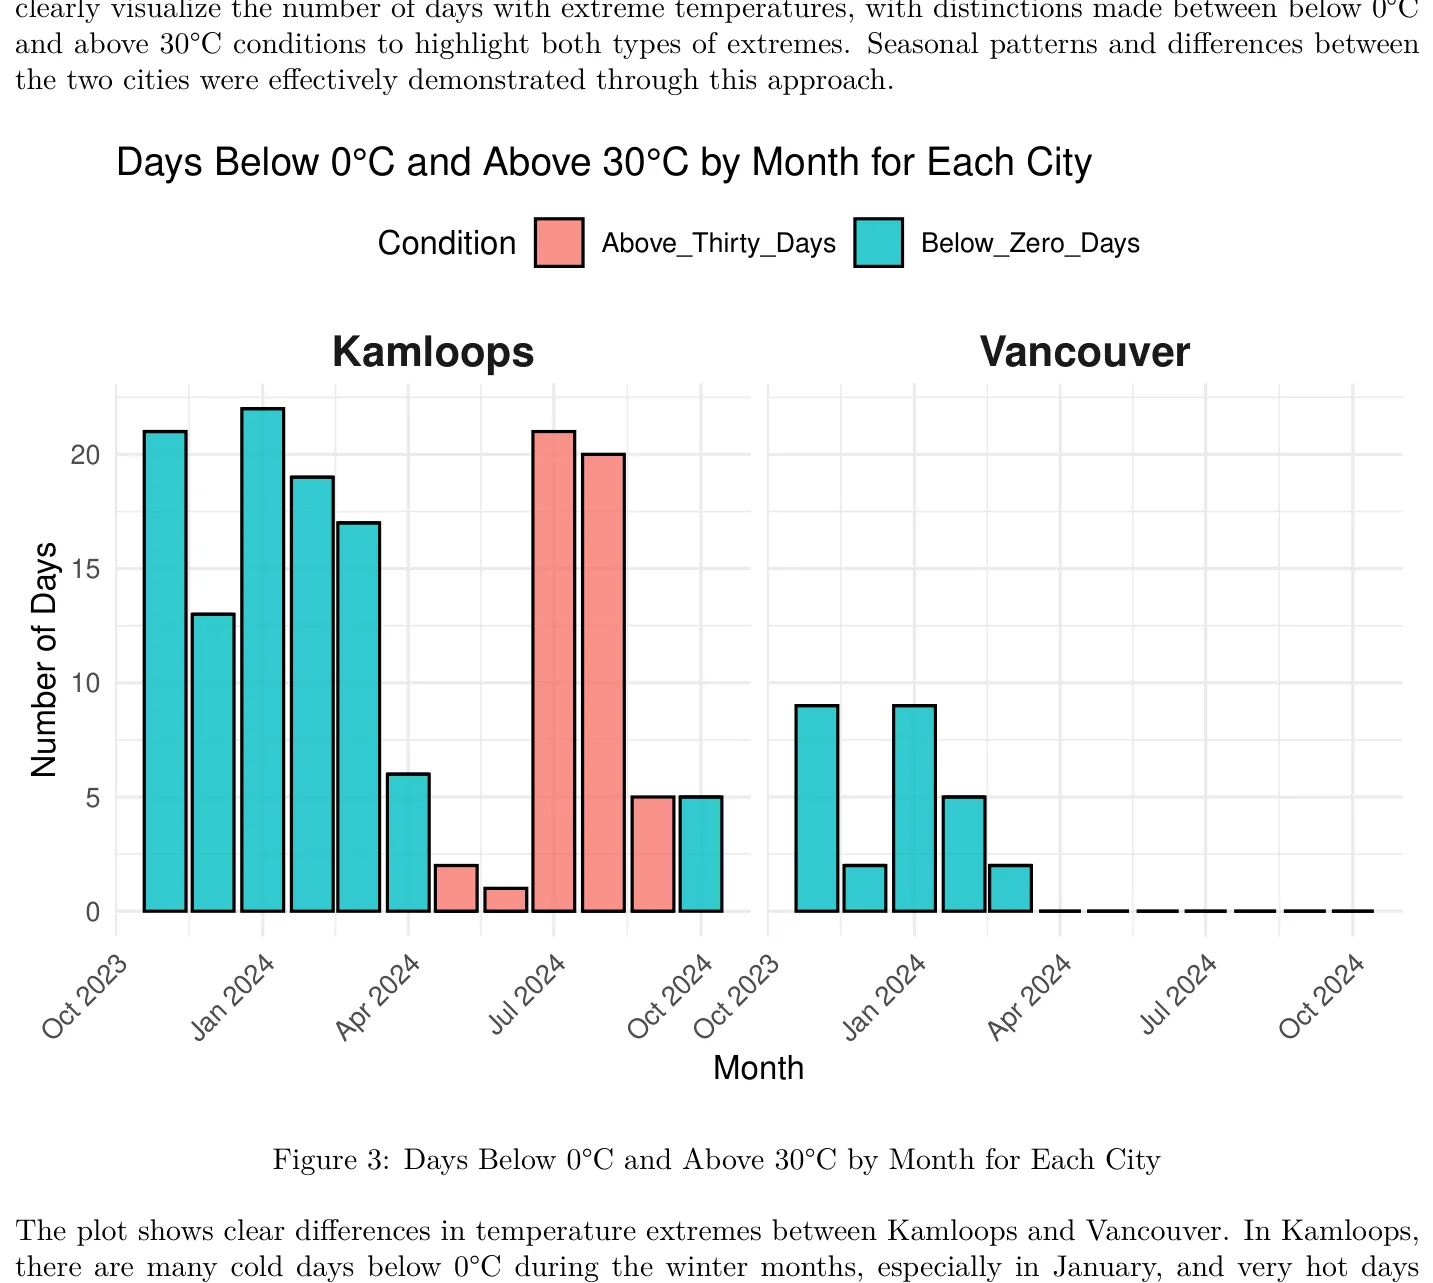
Monthly counts were created for days with minimum temperature below 0°C and maximum temperature above 30°C, then displayed with city-specific facets.
06 / Key findings
Geography produces two very different climate profiles
Temperature
Kamloops varies more
Colder winters and hotter summers create a much wider seasonal temperature range.
Precipitation
Different regimes
Vancouver receives more rain, while Kamloops receives more snow.
Extremes
Kamloops has more
It records more freezing days and also experiences summer temperatures above 30°C.
Climate type
Coastal vs. inland
Vancouver is milder and wetter; Kamloops is drier with stronger seasonal variability.
07 / What this demonstrates
Turning daily climate records into clear comparative visual stories
The project emphasizes practical data preparation and visualization: transforming raw daily weather records into monthly summaries, comparative plots, and spatial representations that communicate climate differences clearly.
- R data manipulation with dplyr and tidyr
- User-defined functions and loops
- Joins and long-format reshaping
- Monthly aggregation and summary statistics
- Time-series comparison with confidence intervals
- Spatial mapping with sf
- Faceted bar charts for extreme-temperature counts
- ggplot2-based visual communication
Tools and methods