Sustainability Prediction from EPA Waste Data
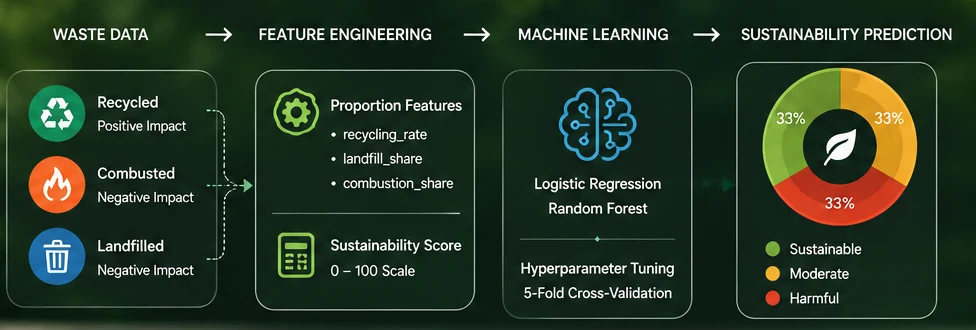
The target was built before any model: recycling, landfill and combustion rates scored, binned into three classes and classified with imbalance handled explicitly.
The EPA's Sustainable Materials Management dataset tracks how municipal solid waste in the United States was generated and handled by material category and year. Most of the analytical work happened before any model was trained: deciding what “sustainable” should mean as a number, and how to turn that number into classes without letting imbalance quietly decide the result.
Pipeline
- 01
Clean
- 02
Engineer
- 03
Score
- 04
Label
- 05
Model
- 06
Tune
3
sustainability classes
3
engineered rate features
2
classifiers compared
5-fold
cross-validated grid search
01 / The dataset
Decades of EPA waste tonnage, by material category
The data is drawn from the EPA's Sustainable Materials Management (SMM) dataset, accessed via Data.gov, which tracks how municipal solid waste in the United States was generated and handled by material category and year.
| Field | What it captures |
|---|---|
| generated_tons | Total waste generated for a material category in a given year |
| recycled_tons | Portion of that waste diverted to recycling |
| combusted_tons | Portion sent to combustion |
| landfilled_tons | Portion sent to landfill |
| year, material | Reporting year and material/product category |
02 / Preprocessing
From raw tonnage to comparable rates
Records with zero or missing generated_tons were removed, since a rate cannot be computed without a valid denominator. Remaining gaps in the waste-component columns were handled before three proportion-based features were engineered so that categories of very different scale could be compared fairly.
recycling_rate
Recycled share
Recycled tons divided by generated tons.
landfill_share
Landfilled share
Landfilled tons divided by generated tons.
combustion_share
Combusted share
Combusted tons divided by generated tons.
03 / The sustainability score
A single weighted number, scaled 0 to 100
The three rate features are combined into one sustainability score using a weighted formula: recycling is rewarded, landfill and combustion are penalized, and the result is scaled to a 0 to 100 range for interpretability.
+  recycling_rate      positively weighted
−  landfill_share      negatively weighted
−  combustion_share    negatively weighted
→  scaled to 0 … 100
Weighting direction
04 / Class labels
The continuous score becomes three classes
The 0 to 100 sustainability score is discretized into three categories using quantile-based binning, which sets the class boundaries from the data's own distribution rather than fixed cutoffs, so the classes come out closer to balanced.
| Class | Meaning | Status |
|---|---|---|
| Harmful | Score of 0. Negligible recycling relative to landfill and combustion. | Low sustainability |
| Moderate | Mixed handling, with recycling only partly offsetting landfill and combustion. | Mid range |
| Sustainable | Recycling dominates the material's disposal pathway. | High sustainability |
05 / Models
A linear baseline against a non-linear alternative
Two classifiers were trained on the engineered rate features to predict the sustainability class, chosen to represent two different assumptions about how the features relate to the outcome.
Model 01
Logistic regression
Features scaled with StandardScaler. class_weight="balanced" to offset class imbalance. Multinomial classification across all three classes.
Model 02
Random forest classifier
Captures non-linear relationships between rate features. Balanced class weights applied. Hyperparameters tuned via GridSearchCV.
06 / Hyperparameter tuning
Tuning the random forest with grid search
The random forest was tuned over four hyperparameters using GridSearchCV, with each candidate combination evaluated by 5-fold cross-validation and scored on macro F1, which weights every class equally regardless of how many examples it has.
| Hyperparameter | Controls |
|---|---|
| n_estimators | Number of trees in the forest |
| max_depth | Maximum depth of each tree |
| min_samples_leaf | Minimum samples required at a leaf node |
| max_features | Number of features considered at each split |
07 / Key findings
What mattered most for classifying sustainability
Strongest predictor
Recycling rate
The single most influential predictor of sustainability class, ahead of landfill share, combustion share, and any raw tonnage feature.
Rates over raw values
Proportion features carried the signal
recycling_rate, landfill_share and combustion_share carried more predictive signal than the raw generated, recycled, combusted, or landfilled tonnage they were built from.
An open limitation
Imbalance persists
Class imbalance is present in the labelled data despite the quantile-based binning, and it measurably affects model performance, which is why macro F1 rather than accuracy was used to evaluate and tune both classifiers.
08 / What this demonstrates
Turning raw tonnage into a defensible classification target
Most of the analytical work here happened before any model was trained: deciding what “sustainable” should mean as a number, and how to turn that number into classes without letting imbalance quietly decide the result.
- Cleaning invalid and missing records
- Engineering proportion-based features from raw counts
- Constructing a weighted composite score
- Multinomial classification with class-weight balancing
- Hyperparameter tuning via grid search
- Evaluating with cross-validated macro F1 under class imbalance
Tools and methods